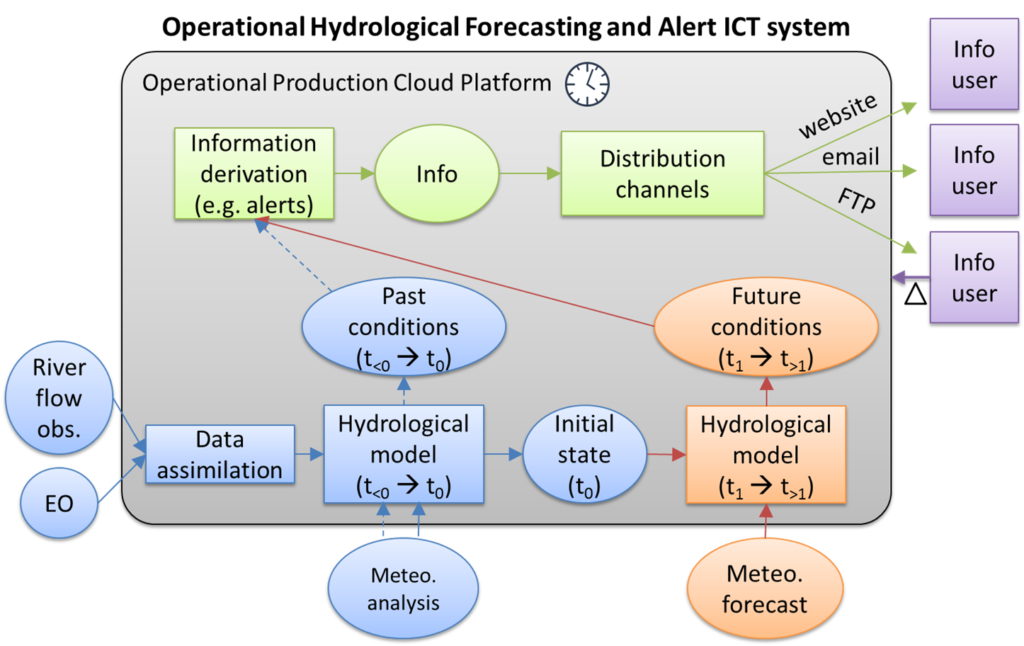

In FANFAR, hydrological forecasts and flood risk information are produced using an operational hydrological forecasting and alert pilot ICT system. The core of the system is a hydrological model, whose main function is to predict the effects of meteorological dynamics (e.g. rainfall and temperature) on river flow, water level, soil moisture in rivers, lakes, wetlands, and all land surface areas. In FANFAR, we use the Niger-HYPE model for the Niger River basin and the World-Wide HYPE model for the entire West African domain (http://hypeweb.smhi.se/explore-water/geographical-domains/). Two simulations are carried out to make a forecast with these hydrological models:
The next step in the process (in green above) is to derive useful forecast and flood risk information. What is considered ‘useful’ clearly depends on the user, which is defined together during the FANFAR co-design workshops. Typically, a set of flood risk thresholds are specified based on historic conditions or local knowledge. The forecasts are then compared against these thresholds to determine the severity of the situation and the potential flood risk level. This information is finally delivered to users through various distribution channels (e.g. online visualisation or email and SMS to flood risk information subscribers).
Operational forecasting heavily relies on scheduled, automated execution and monitoring of the data flows and processing tasks on an ICT environment that is always up and running (in grey above).